
During the weekend I was delighted to find a good blog series from a Canadian data scientist: Susan Li. Digging through her blogs I found an article about text classification model selection. Next thing I’m going to do is to follow that post and test those different models to logging data.
Getting the data: ~2 GB of logs
I’m going to upload full journalctl json dumps from 2 cloud machines running Arch Linux and the Ubuntu 18.04 LTS logs from a machine I used for a week setting the working environment up in this project. I’ll push these logs into an ElasticSearch database with simple scripts and generate some visualisations.
I had the Ubuntu running on an external SSD. To get those logs, I plugged in the SSD and navigated to the directory containing the logs (/run/media/user/<uuid> as a result of automounting). Then I run the following command:
$ sudo journalctl -D $PWD -o json > /home/tqre/ubuntu_logs.json
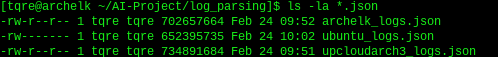
I copied the files over to my ElasticSearch -cloud machine. Now I have 3 json formatted files I want to upload into my database.
Out of memory? Just scale it up!
I made a script to use the ElasticSearch’s bulk API to upload all the log entries into database. Everything worked fine testing with small files (at the time of writing all output is redirected to /dev/null), but submitting 600MB Ubuntu logs crashed the database. Glancing at the logs: out of memory, not a big suprise tbh.
Time for cloud to shine: from 2GB to 16GB memory with few clicks. But nothing still happens with the API request. Figured it out: I had to tune elasticsearch settings to accept bigger requests:
$ cat /etc/elasticsearch/elasticsearch.yml
path.data: /var/lib/elasticsearch
path.logs: /var/log/elasticsearch
network.host: 127.0.0.1
http.port: 9200
http.max_content_length: 1000mb
…and I had to increase the jvm heap size (basically Java Virtual Machine memory) to 8G:
$ cat /etc/elasticsearch/jvm.options
<output omitted>
-Xms8g
-Xmx8g
<output omitted>
Better idea could probably be to split the data into smaller parts… but after these modifications, uploading all the data took about 5 minutes of machine time while the cloud machine had only 1 CPU.
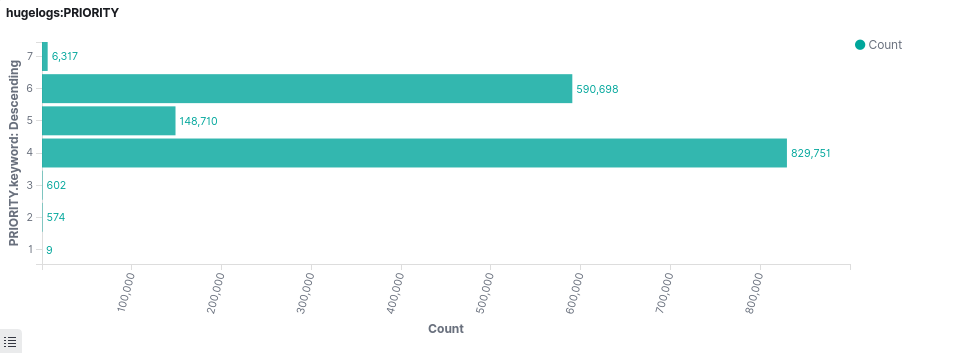
Behold the data: over 2,1 million log entries
Here is a visualisation made with Kibana: printk kernel log levels. No zero-level entries though, and only 9 alert-level messages, but at least a decent sized dataset to work with!
On a plus side, the cloud machine handling the database didn’t need extra resources to work with once the data was in. I scaled my ejk-machine back to 1xCPU and 2GB memory. And looks like I forgot untagged entries from the visualization. We’ll take a closer look at the dataset at some point.
