
EJK stack anyone? Or does the ‘L’ in ELK mean Linux?
This is an experiment and demonstration of how to move Linux system logs into elasticsearch database. The idea is to use simple and native Linux tools to populate the database with system logs. As I found out earlier, systemd-journald can format log output into JSON and while at it, supplies extra metadata along. At least it feels fast and efficient, and it looks like I don’t need any other tools to preprocess my server’s logs. As I’m new to Elasticsearch, this serves also as a learning process how to use the database itself.
The Elasticsearch database runs on Arch Linux in a basic cloud VM (the finnish UpCloud, they’re awesome!), and I have an nginx proxy server in front to access my database remotely with the visualization tool Kibana. There are tons of guides floating in the net how to set this up on your favourite distro.
1. How to add json data into elasticsearch database
Creating a json file with journalctl is a walk in the park, but first we have to figure out how to use elasticsearch. It involves curl usage, and the elasticsearch starter tutorial can be found here.
Keeping it simple, we are doing a hello-world example first. First we need a json file:
$ echo "{\"hello\":\"world\"}" > helloworld.json
$ cat helloworld.json
{"hello":"world"}
Then use curl to to put it into our database:
curl -XPUT localhost:9200/helloworld/_create/1?pretty \
-H 'Content-type:application/json' \
-d @helloworld.json
Using the ‘?pretty’ query string makes the database response more readable:
{
  "_index" : "helloworld",
  "_type" : "_doc",
  "_id" : "1",
  "_version" : 1,
  "result" : "created",
  "_shards" : {
    "total" : 2,
    "successful" : 1,
    "failed" : 0
  },
  "_seq_no" : 0,
  "_primary_term" : 1
}
We have an index called ‘helloworld’, and we should see it with either a HTTP GET -request, or logging into our Kibana dashboard and performing the search there.
$ curl -XGET localhost:9200/_search?pretty
...<output omitted>
      {
        "_index" : "helloworld",
        "_type" : "_doc",
        "_id" : "1",
        "_score" : 1.0,
        "_source" : {
          "hello" : "world"
        }
...<output omitted>
2. Adding more data
We want to load files with many lines of JSON. In Elasticsearch, there actually exists an API designed for that: the bulk API. It is efficient and optimized for low overhead, which sounds nice. However, it has a format of a kind, and I want to be as straightforward as possible.
The large log data chunk in json format is trivial to obtain now that we know the journalctl magic. With the ‘-b’ tag we get only the logs from the current boot. At first I had a 163M file on my hands, then realized the server was last booted 5 days ago. I updated the system and rebooted it to obtain a smaller file to start with (500K).
$ sudo journalctl -b -o json > systemlog.jsonA simple PUT request can’t handle this, errors all over. Reading the docs and testing some more, following solution rises: loop the file line by line and do a curl command to store the data. Here is a simple bash script to achieve it:
$ cat writelogtodatabase.sh
#!/bin/bash
while read line; do
	curl -XPOST localhost:9200/$1/_doc/?filter_path=_seq_no \
	-H 'Content-type:application/json' \
	-d "$line"
done < $2
The script takes 2 arguments: the database index name and the file to read from. The _filter_path -query filters most of the output away. So lets run the script:
$ ./writelogtodatabase.sh testlogs systemlog.json
{"_seq_no":0}{"_seq_no":1}{"_seq_no":2}{"_seq_no":3}{"_seq_no":4}{"_seq_no":5}
...<output omitted>...
{"error":{"root_cause":[{"type":"mapper_parsing_exception","reason":"failed to parse"}],"type":"mapper_parsing_exception","reason":"failed to parse","caused_by":{"type":"json_parse_exception","reason":"Unexpected character ('p' (code 112)): was expecting comma to separate Object entries\n at [Source: org.elasticsearch.common.bytes.BytesReference$MarkSupportingStreamInputWrapper@643d34cf; line: 1, column: 493]"}},"status":400}
...<more output and lots of similar errors>...
{"_seq_no":758}{"_seq_no":759}
The command took some time, so probably the bulk API is the way to go with larger files. Also some parsing errors happened, all of them of the type ‘unexpected character’. We’ll look into that some other day, as our script actually makes it harder to find out the cause. Anyway, most of the data went in nicely. Now I’ll log into Kibana and see what went in:
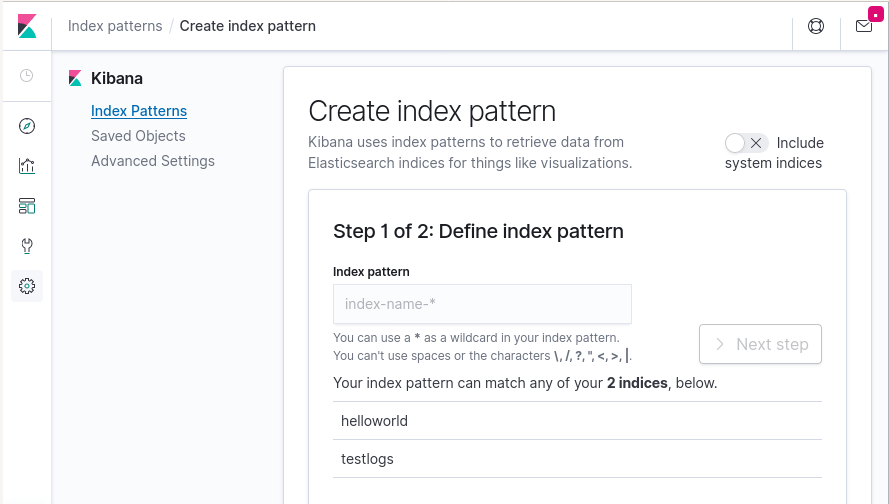
Both indices are there! We’ll create an index pattern from testlogs, and take a look at the actual data:

Looks like system logs to me, basics of the mission accomplished! The road forward suddenly becomes quite clear: the metadata causes some fields to be flagged as unknown, everything is in string format, the timestamps are not human readable, a centralized approach (machine_id’s are supplied aswell), remote transport methods, container logs, realtime updates… sounds like a decent sized project.
3. Some numbers with bigger files
The platform: 1xCPU 2GB RAM cloud machine in UpCloud running Arch Linux. Note that ‘#’ means running as root and ‘$’ as a regular user.
# time journalctl -o json > largesystemlog.json
real	0m5.029s
user	0m4.577s
sys	0m0.219s
# stat largesystemlog.json
  File: largesystemlog.json
  Size: 176541371 	Blocks: 344808     IO Block: 4096   regular file
The output generation is pretty fast, and already on this stage it is possible to parse the data! For example: the user id meta-tag:
$ sudo journalctl _UID=1000I wonder how other similar programs perform? And how big are the files we are talking in centralized logging systems? How about other cloud providers? Lets see how long it takes to transport this file into our database:
$ time ./writelogtodatabase.sh largelog largesystemlog.json
{"_seq_no":0}...
<lots of output and unexpected character errors>
...{"_seq_no":118652}
real	13m17.378s
user	5m11.511s
sys	3m24.650s
I did the dishes while the script was running, and now I have almost a week’s worth of system logs in a database, 120k entries. The bulk API should make it faster, but lets take a look what we have with Kibana.
4. Inspecting the data reveals even more!
The larger systemlog revealed some other interesting qualities from the journalctl json output: there are key-value pairs that I didn’t catch from the documentation (or I didn’t find the right one). Here is an example:
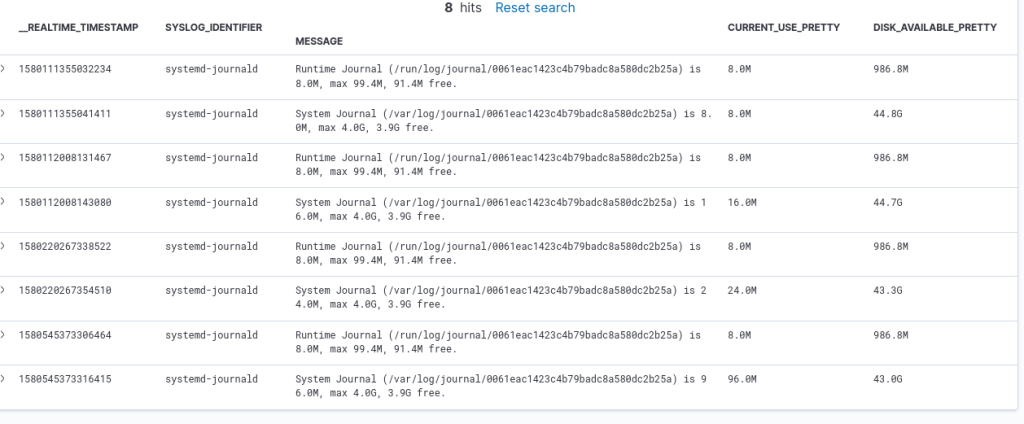
Network interfaces and IP-addresses are also already there:
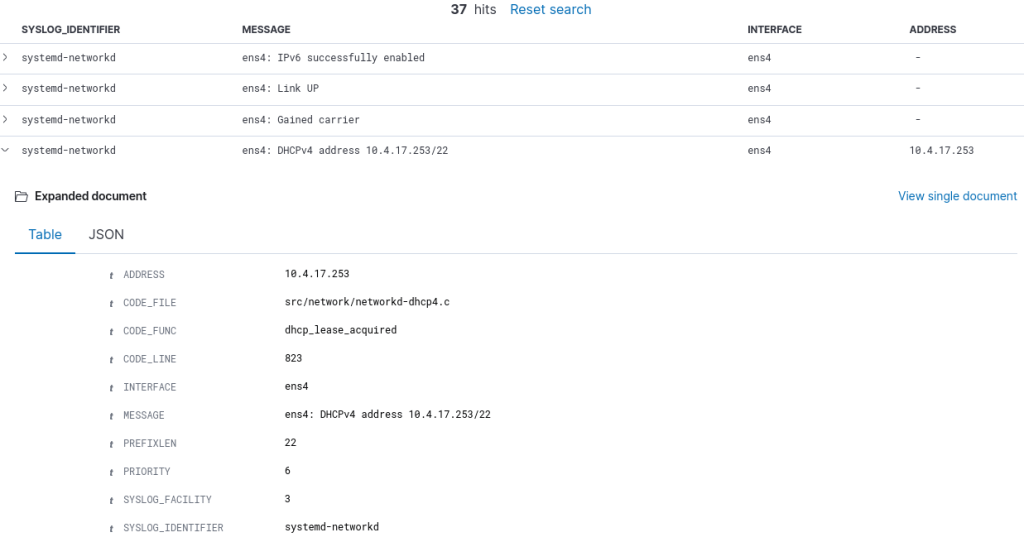
Even more textual data can be generated with journalctl ‘-x’ tag:
https://www.freedesktop.org/wiki/Software/systemd/catalog/
Conclusion
This was a good learning experience and an effort definetely not wasted, even if it doesn’t contribute much to the project yet. If we get the basics of AI/ML working in good time, we can start looking into generating datasets as they play a crucial role with machine learning and neural network training.
-Tuomo Kuure (tqre)
