
The project is approaching end, and we are ready to deploy! In fact we have already deployed, and this is a writeup of a Sunday spent with trying to deploy something extra that didn’t work properly to begin with: Nginx and default log formats.
There are a couple of days left for field testing. Joni has indeed already deployed the customised log format version earlier this week to Google Cloud with Ubuntu. I worked the ‘cherry on top’ yesterday, and the program now actually works with Apache and Nginx default log settings, barely. Here is a writeup what happened:
Meet Archelk
I’m reporting a deployment on one of my Arch Linux servers in UpCloud. The server is running Nginx as a proxy server to authenticate to Kibana. We have installation instructions on our Github page, so lets see what happens.
I haven’t visited the server for some time, so I’ll run full updates for it first (2 windows here on the screenshot).
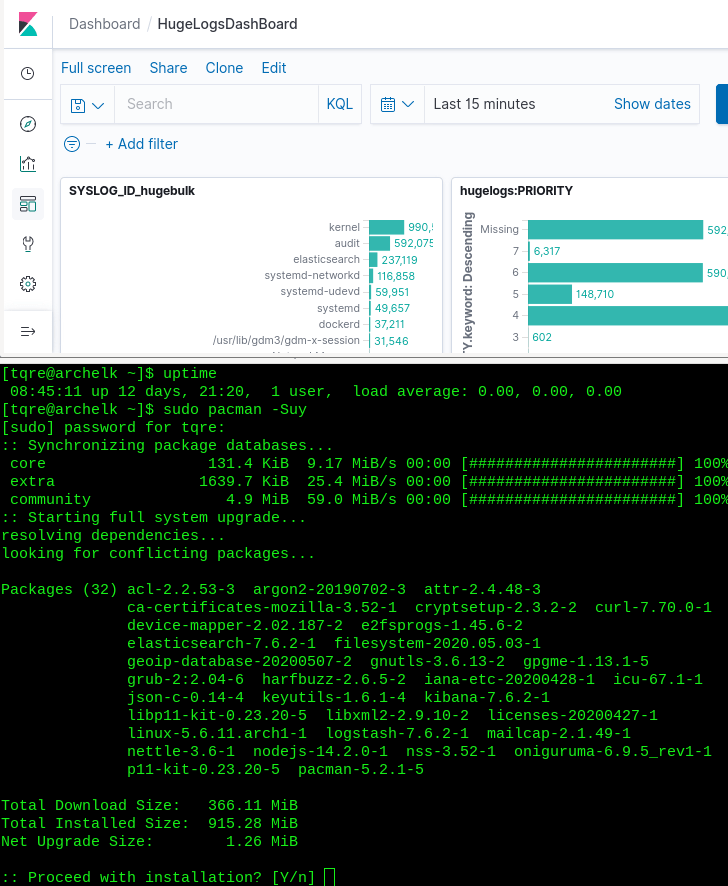
Have to reboot it too, as there is a kernel update. Issuing ‘sudo reboot’, waiting 10 seconds and logging back in 😉
Nginx access.log = Apache access.log
We realized earlier this week, that both Apache and Nginx access logs use the same format on a default installation. So if we have support for default format, we cover the most of the web server ground!
There is a difference though: Apache rotates logs on default (or is this Ubuntu specific?). Looking at the access.log on my archelk, there is one 5M file starting January 28th this year. I didn’t realize until this morning I had this, it is just a proxy server, but sure, there are lots of logs! 30k+ lines 🙂
Installing Lokari
I’ll choose the local installation, and I’m not going to touch any Nginx log settings. The server is running Python 3.8.2, and all the required python libraries are in Arch’s official packages, so I don’t even have to install and use pip here.
$ sudo pacman -S python-tensorflow python-pandas \
python-scikit-learn python-matplotlib
This will be interesting, some of the library versions are going to be newer than in the docker container that has been used. Only thing left is to clone The Repository.
~$ git clone https://github.com/Dunttus/AI-Project
Train the model
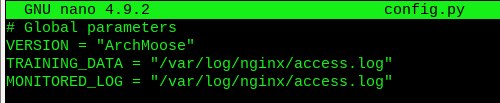
As nginx has already has all the logs in one file, I can start training the model. First setting the paths in ‘config.py’.
Now I’m starting to think permissions. A normal user probably has no write access to that place, and really shouldn’t. So do I run the training with sudo or give my user perms there? The writing could be done elsewhere too, but the docker-installation probably breaks. I’ll go sudo first.
And we have a crash. Were the log formats the same after all? Or maybe there is something extra there?
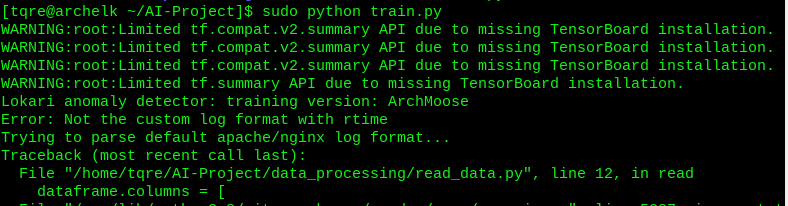
Well. I have to look at the logs themselves closer and try to figure this out. There are some entries that can’t be processed, as a small test sample seems to work.
The main issue here is that the default log format is not consistent in structure. The quick pandas parser I wrote yesterday fails with lines like the following:

There is no method, request and protocol in the middle…
After debugging
Now it should work… some of the fixes were quite dirty 😉
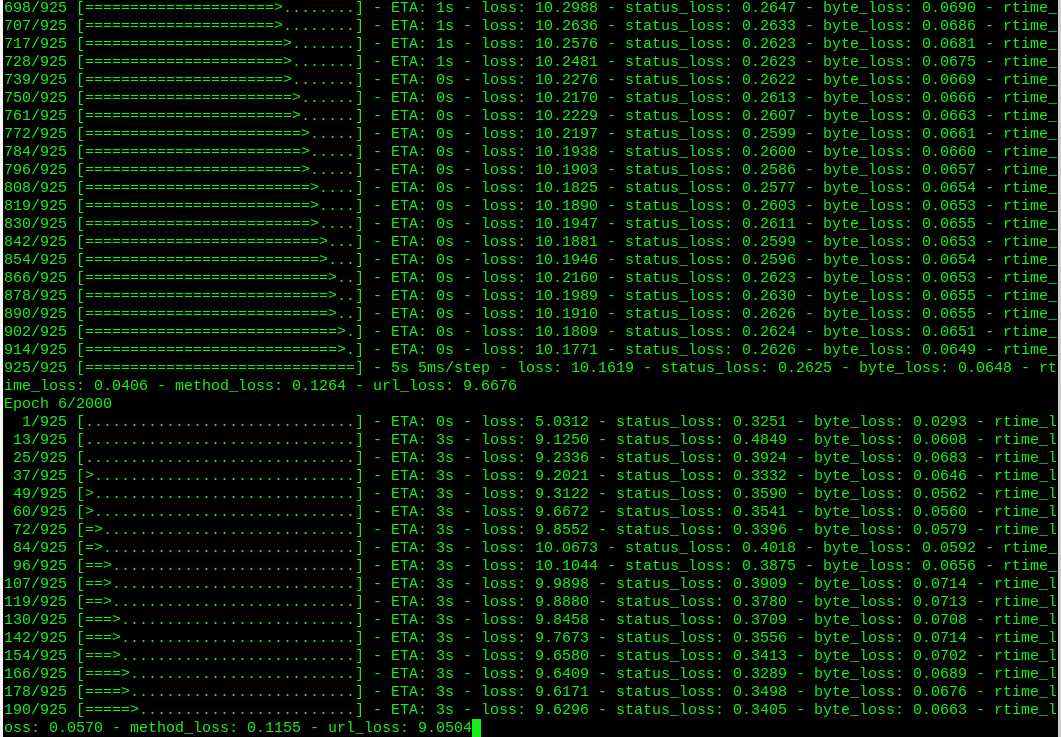
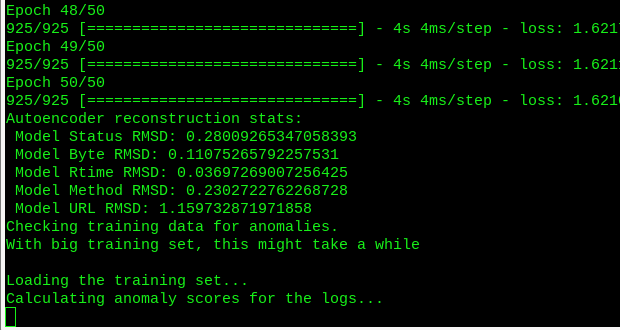
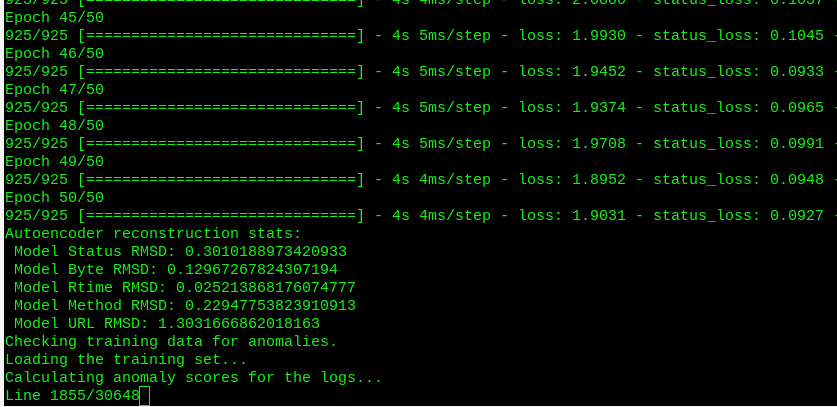
The VM runs out of memory as it is quite full with elasticsearch and kibana running already. Also, it’s not processing the whole data set, which contains almost 30k lines. I set the training to just 50 epochs, which completes.
When checking the training data, it really takes it’s time: a progress indicator would be nice. I’ll implement it while waiting.
Watching the memory consumption, this doesn’t tax the server too much. But there is a crash again. Have to make some more null exceptions… at least the progress meter is working properly.
So this line gives me headaches, and I don’t want to make another exception. As that is a neverending road. But this actually needs just one line, the same I used in earlier processing.
66.240.205.34 - - [31/Jan/2020:10:28:11 +0200] "145.ll|'|'|SGFjS2VkX0Q0OTkwNjI3|'|'|WIN-JNAPIER0859|'|'|JNapier|'|'|19-02-01|'|'||'|'|Win 7 Professional SP1 x64|'|'|No|'|'|0.7d|'|'|..|'|'|AA==|'|'|112.inf|'|'|SGFjS2VkDQoxOTIuMTY4LjkyLjIyMjo1NTUyDQpEZXNrdG9wDQpjbGllbnRhLmV4ZQ0KRmFsc2UNCkZhbHNlDQpUcnVlDQpGYWxzZQ==12.act|'|'|AA==" 400 150 "-" "-"
Sacrifices
I had to stop elasticsearch and kibana for the training process to be a bit faster. This is with a big log file, and the resources on the server aren’t that big: 2xCPU, 2G RAM. Memory became an issue, and I beefed up the cloud server temporarily to 4xCPU 8GB RAM. Training is still slow…
Training succeeds finally with no problems using default Nginx log formats, but it takes quite a while to analyze the training set. And it crashes, lots. All kinds of stuff. I’m sacrificing missing interesting logs to get this working on the default settings. Dirty and patchy code, and I really recommend to use the log format the program was designed to work with. It separates the methods and request lines clearly, and at least from Lokari’s perspective, it works better.
There might be quite a bit of intricacies related to how web servers produce their logs, but in these days of big data,if the logs come out in good format, it is easier to process them. Systemd can output journalctl logs in JSON, so why not web servers? It is possible with tinkering custom log formats, but this could be default behaviour!
We are using all kinds of tools to visualize data and process it, and the people interested in the logs to the detail would surely like if it was in easy-to-process format.
Results
A day of debugging and dirty field work gave me insights on logs, but it also yielded some graphics and results 🙂 So here are the results:
Default nginx log: /var/log/nginx/access.log
Log file size: 5,6M with 30k lines
Total time (training + checking training data): 90 minutes
config.py:
EPOCHS = 2000
PATIENCE = 50
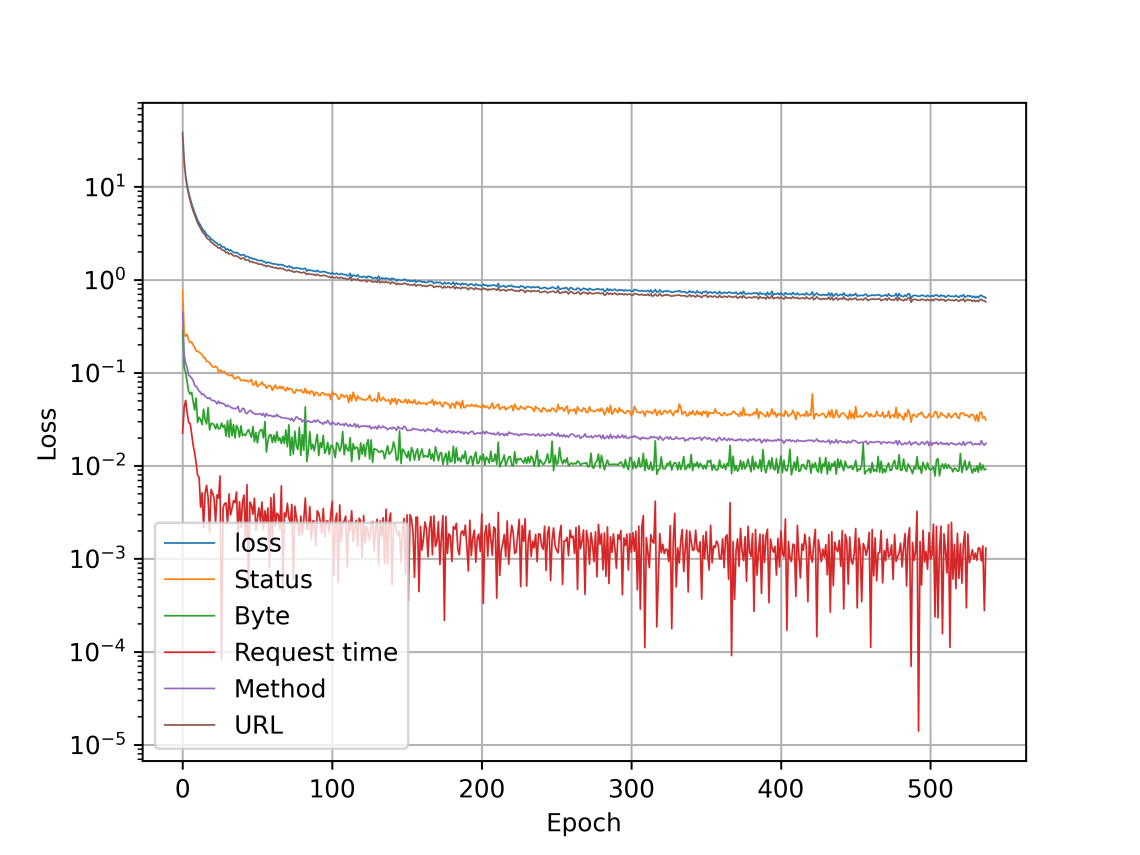
The training evens out after 200 epochs or so. Only significant improvement comes from url, which is undoubtedly the hardest part with so much data. Request time is ignored with default log format.
Finding anomalies from the graph is bit hard, and the color legends are wrong 😦 That is URL, not status that gives such high scores. Gotta fix that still…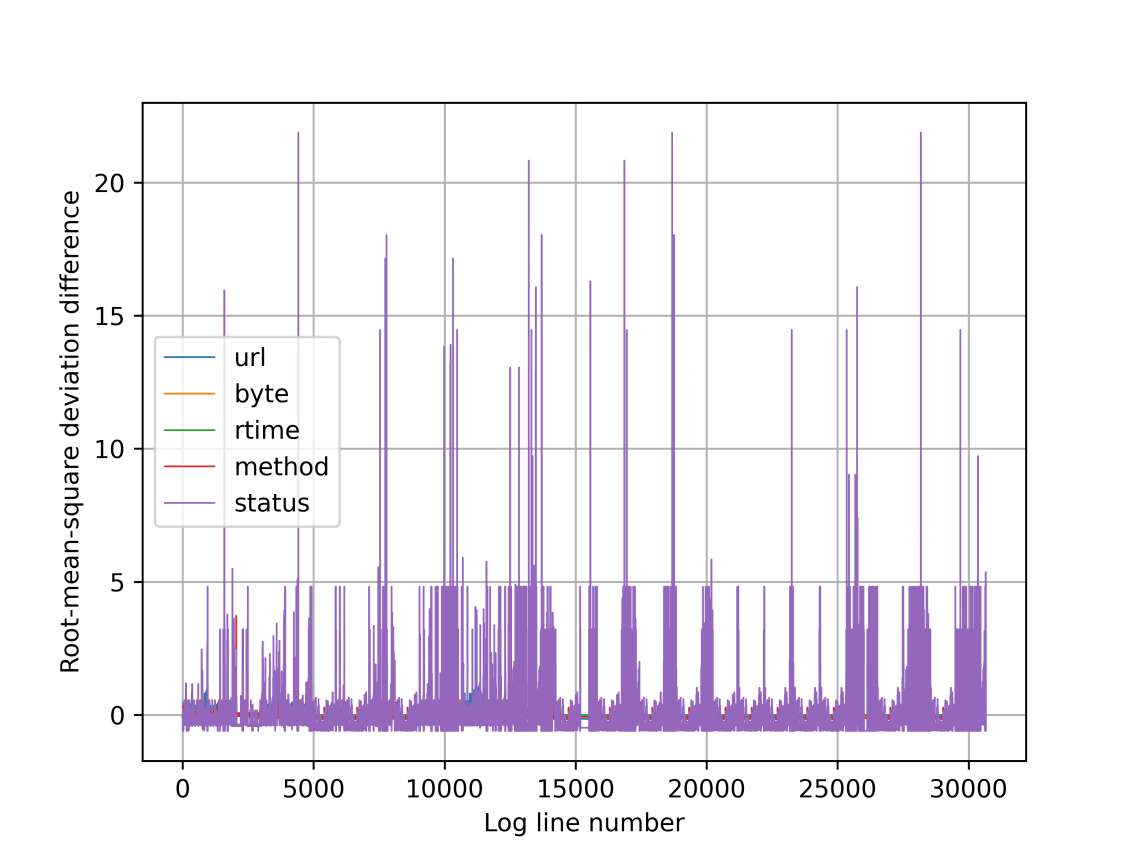
The detector is up and running on the server now, it runs on pretty small memory footprint. It picked up ~1/5 of all the logs as the training was hard and slow and restricted…
So this is the bit patchy version running on Nginx logs now 🙂 At least it works! I’ll set the byte threshold higher, as these came up as I logged in to the Kibana 😀
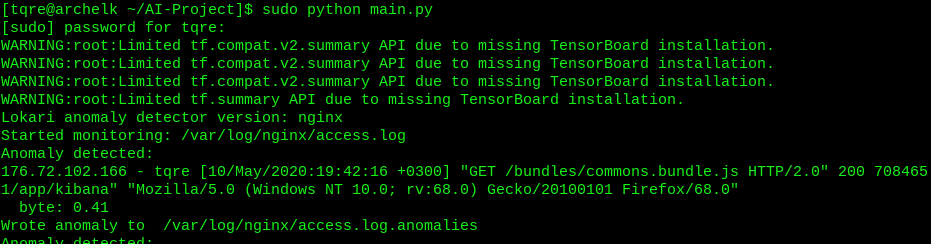
I’ll tune the thresholds to get the most interesting of the logs. These are really suboptimal values, but have to settle this now. And no, I’m not using Windows 10 and FF 68 😉
RMSD_STATUS = 3
RMSD_BYTE = 1
RMSD_RTIME = 0.3
RMSD_METHOD = 0.6
RMSD_URL = 6
I’ll leave Lokari to do it’s thing, and start concentrating on the final report and presentation on Friday morning.
Final thoughts
The default log format support was an extra that just had to be tried 😉 It should have been designed right from the start, so the implementation is really dirty, and might crash. Joni is running the customised logformat versions field tests, so we’ll have some real data from actually using the program properly.
There are so many things to improve on this idea it is hard to stop. And we have to deliver soon. Now it really is time to wrap the project up to a presentable packet.
